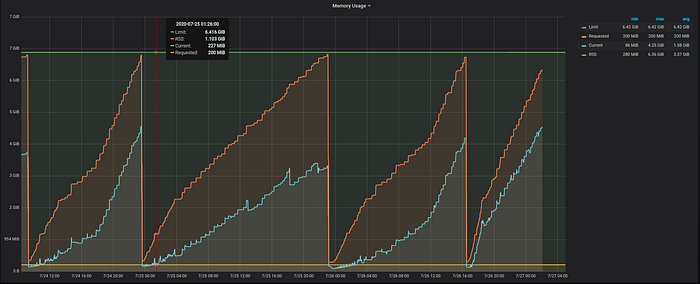
Memory_working_set vs Memory_rss in Kubernetes, which one you should monitor?

In this article, we will know how cAdvisor collects memory_working_set and memory_rss metrics. Which one we should monitor, and which one causes OOMkill if we applied memory limits to your pods.
Before we get to the difference:
If you exec inside your container and navigate to the following directory, you can find all the container’s memory information you may need, usage, limits, cache, how many time your container got oomkilled, ..etc:
cd /sys/fs/cgroups/memory/List the content of this directory and you will get the following control files:

Each file contains a piece of information about the memory. You can read more about them here.
What we are really interested in now is memory.status file:
root@test:/sys/fs/cgroup/memory# cat memory.stat
cache 32575488
rss 33964032
rss_huge 0
shmem 1757184
mapped_file 16625664
dirty 0
writeback 0
pgpgin 19272
pgpgout 2871
pgfault 16137
pgmajfault 66
inactive_anon 1757184
active_anon 33927168
inactive_file 27709440
active_file 2433024
unevictable 0
hierarchical_memory_limit 4089446400
total_cache 32575488
total_rss 33964032
total_rss_huge 0
total_shmem 1757184
total_mapped_file 16625664
total_dirty 0
total_writeback 0
total_pgpgin 19272
total_pgpgout 2871
total_pgfault 16137
total_pgmajfault 66
total_inactive_anon 1757184
total_active_anon 33927168
total_inactive_file 27709440
total_active_file 2433024
total_unevictable 0
cAdvisor gathers those numbers and uses them to calculate memory metrics which are collected by Prometheus.
The difference between “container_memory_working_set_bytes” and “container_memory_rss”:
container_memory_rss:
From cAdvisor code, the memory RSS is:
The amount of anonymous and swap cache memory (includes transparent hugepages).
and it equals to the value of total_rss from memory.status file, find the code here:
ret.Memory.RSS = s.MemoryStats.Stats["total_rss"]Don’t confuse RSS with ‘resident set size’. From kernel documentation:
Note:
Only anonymous and swap cache memory is listed as part of ‘rss’ stat.
This should not be confused with the true ‘resident set size’ or the
amount of physical memory used by the cgroup.
‘rss + file_mapped” will give you resident set size of cgroup.
(Note: file and shmem may be shared among other cgroups. In that case,
file_mapped is accounted only when the memory cgroup is owner of page
cache.)
container_memory_working_set_bytes:
From cAdvisor code, they define the working set memory as:
The amount of working set memory, this includes recently accessed memory,dirty memory, and kernel memory. Working set is <= "usage".
and it equals to Usage minus total_inactive_file, find the code here:
inactiveFileKeyName := "total_inactive_file"
 if cgroups.IsCgroup2UnifiedMode() {
  inactiveFileKeyName = "inactive_file"
 }workingSet := ret.Memory.Usage
 if v, ok := s.MemoryStats.Stats[inactiveFileKeyName]; ok {
  if workingSet < v {
   workingSet = 0
  } else {
   workingSet -= v
  }
 }
ret.Memory.WorkingSet = workingSet
Note:
The value from kubectl top pods the command is from container_memory_working_set_bytesmetric.
Which one is important to monitor?
Now we know how cAdviser gets ‘RSS’ and ‘workin_set_bytes’ values, which one to monitor?
It is worth mentioning that if you are using resource limits on your pods, then you need to monitor both of them to prevent your pods from being oom-killed.
If ‘container_memory_rss’ increased to the limits -> oomkill.
And if ‘container_memory_working_set_bytes’ increased to the limits -> oomkill.
Useful Articles:
- Know more about dirty memory here.
- Anonymous memory here.
- https://medium.com/faun/how-much-is-too-much-the-linux-oomkiller-and-used-memory-d32186f29c9d
- https://blog.freshtracks.io/a-deep-dive-into-kubernetes-metrics-b190cc97f0f6